Led by customer, driven by data – The power of the customer in today’s automotive transformation

Munich, February 2023

Customer Journey management: Oriented by customer – Driven by data. A roadmap to optimize the customer journey based on data insights

Munich, February 2023
A

s the automotive industry’s transformation accelerates, and online interactions with customers become an increasingly vital part of the sales journey, manufacturers and dealers must collect and process high quality customer data to adapt to rapidly changing consumer needs.

To stay ahead of the increasing number of new competitors, as well as long-established rivals, companies should adopt an approach that uses data analytics to identify pain points and optimization potential to create a customer-friendly sales journey at every stage of the route.

The approach is divided into two integrated Diverge and Converge phases. The first identifies data relating to customer needs which is collected during the explore phase and classified during the define phase (see Figure 1 below). Using this processed data, solutions can then be identified and implemented during the following develop and deliver phases.

Figure 1: Led by customers, driven by data – the right approach for building customer-friendly journeys  

First steps – set the direction for a customer-friendly journey

The company’s strategic objectives form the foundation of the explore phase and set the direction of the entire process. Further insights about how to achieve a customer-oriented journey are collected via a 360° analysis of external data from customers, competitors and other industries, and internal data from the business’s perspective (see Figure 2).

For the “inside-out” corporate analysis, we collected, analyzed and evaluated internal data and information from the automotive client to identify the needs of the customer and the business from the company’s point of view. For the “outside in” assessment, we analyzed information from outside the company, on customers, competitors and the market in general. We took a closer look at the company’s current customer journey to identify areas for improvement, and using this information, we identified key customer moments.

They were based on the following four consecutive stages of the customer journey: awareness of the product, consideration, purchase, and ownership. Our research identified the points that create delight for customers that might be relevant for automotive manufacturers’ customer journeys.


Figure 2: 360° analysis of data from customer and business perspectives

The next move – defining the key customer moments along the way

In the define phase we sorted all our insights from the 360° analysis into major categories which enabled us to identify the challenges and opportunities during the customer journey. We then asked, “How might we” (HMW) questions to help define these key customer moments through further analysis (see Figure 3 below).

When formulating HMWs, it is important to ensure that the questions relate specifically to the existing problems and identified insights but are formulated as broadly as possible in order to be able to generate more ideas for solutions. Furthermore, solution approaches must not already be included in the HWM to avoid limiting the pool of possible solutions by generating fewer ideas.

The HMWs are ultimately clustered in use cases that include data from XXX and pain points with related key performance indicators (KPIs) to create transparency for the entire customer journey. The KPIs are based on the company’s goals, the use case targets which are derived from them, current market conditions, and should cover marketing, sales, finance, and products. 


Figure 3: “How Might We” Questions clustered in use cases

Smooth transition: seamless multi-channel customer journeys

Based on the different stages, we then derived cross-channel customer interactions via detailed micro journeys that illustrate the customer journey target picture for each use case (see Figure 4):


Figure 4: How the customer interacts with the different sales channels

The interaction templates represent all customer touchpoints and their sequence and interrelationships. They show in detail how the customer interacts through the individual offline and online channels, including websites, apps, email and social media. Using interaction templates ensures that the micro journeys via different channels are aligned with each other and merge seamlessly.

To reduce complexity, we split the interaction templates into different segments that simplify the alignments with different stakeholders. These segments guide the implementation and prioritization in building the backlog for the new digital vehicle sales model. Based on the customer journey target picture, the defined KPIs must be tracked and measured using the data points derived from them.

At the start of this process, it is important to perform a current state analysis to identify which of the defined KPIs can already be measured by the existing data points. A gap analysis can then derive requirements for the missing data points. The ultimate goal is to create seamless, real-time tracking across the individual systems and thus maximize transparency and the potential for optimization.

After defining the customer journey target picture and data points for each use case, the product owners define the individual user stories in order to bundle together the requirements for the technical solution design, blueprints, data architecture, and product agnostic assets. One customer touchpoint represents one user story, with the portfolio backlog derived from the user stories. Lastly, impact analyses help prioritize the implementation of the segments, which allows the portfolio roadmap to be created.

Final destination – a customer-friendly journey that is constantly optimized

The segments for each use case can now begin to be implemented by following the derived portfolio roadmap. However, the customer journey needs to be constantly optimized with further measures in order to remain competitive in future. The visualization dashboard is the central tool for the collection and analysis of data relating to changing customer requirements, exposing weak points in the company’s product and identifying the correct optimization measures.

Optimization is based on discovering anomalies in the current customer journey.  By visualizing the KPIs, it is possible to draw conclusions from the difference between the current customer journey and the defined targets and determine best practice solutions which eliminate irregularities. The visualizations enable stakeholders to define pain points and derive action points.

We created a three-tier visualization of KPIs for the entire customer journey to reduce the complexity, split between the Journey View, the Use Case View and the Segment View (please see Figures 5, 6 and 7 below):

Authors
Christian Herr

Principal

Vadim Welter

Senior Associate

Julian Krugmann

Consultant

Journey View

The Journey View provides a cross-use perspective where you can see the customer’s touchpoints with individual use cases and moments without going into detail within the use cases. It shows the current optimal customer journey as the customer is steered through the individual moments and use cases and identifies where the conversions between the moments and use cases can be optimized, based on the objective.

In simplified terms, the optimal customer journey consists of three moments: "Browse Product Information", "Experience the Product" and "Check Out". The customer experiences the use cases "Configuration", "Test Drive" and "Integrated Offer", which represent the optimal conversion toward vehicle sales. One could try to optimize the journey by steering the customer through these moments and use cases but in practice, the task is more complex because there are several optimal customer journey flows, which can further differ depending on the customer group.


Furthermore, this Journey view offers the possibility of identifying moments and use cases where there is a need for optimization. This could mean that conversion at the moment "Compare and weigh up options" is the wrong option because it mainly concerns the Consultation use case. The next step would be to select this use case and look at it in detail, which is possible in the next Use Case View (Figure 6 below).

Use Case View

The Use Case View goes one step deeper and shows the customer’s behavior within a Use Case. In this view, we can use the totals in the conversion rate to see which segments a customer comes into contact with on the way to purchasing his or her car and where there are any break points.

For example, the "Browse Product Information" moment has a poor conversion rate, primarily due to the "Configuration" use case. By selecting "Configuration" in the use case view one can see customer behavior within this use case and notice, for example, that the first retargeting is not working properly. Enough customers are being targeted, but the conversion rate to the end of the journey is poor. Action is therefore required following closer analysis of this segment. 

Segment View

Finally, the Segment View (Figure 7 below) provides a more detailed visualization where one can use KPIs to identify the pain points precisely, and if necessary, conduct a more in-depth analysis to derive the action points and thus improve the customer experience.

In the highlighted example, one can see that the targeting is resonating with sufficient success to draw enough customers back to the site through the initial retargeting. The customer feels engaged. However, it is also clear that targeted customers are not continuing the journey, which may be because while the approach targets many customers, it raises expectations that are not met. Appropriate action points should now be derived, or another specific analysis should be conducted to form action points.

The advantage of our three-layer visualization approach is that one does not need to look at all processes in a complex environment. Instead, one can identify the pain points step by step by narrowing down the problem and working out the required action points.  In addition, the visualization offers different representations for different stakeholders, depending on the required level of detail.

Based on the visualization, the optimization process can be triggered repeatedly like a loop, with the customer journey continually adapted and optimized in response to changing conditions.

Conclusion: An approach that builds customer loyalty and reinforces delight in your vehicles

In the age of digital vehicles, the customer reigns supreme. Rapidly evolving automotive technologies and a host of new market entrants mean consumers can choose between an ever-expanding range of ICE, hybrid and electric vehicles, which constantly leverage and generate real-time data about everything from local weather conditions to the driver’s on-the-road music preferences.

As our report shows, this tech-driven transformation is in turn an opportunity for the industry to develop far more customer-friendly marketing and sales journeys, which are repeatedly optimized by processing and analyzing external consumer and market data and internal business data.

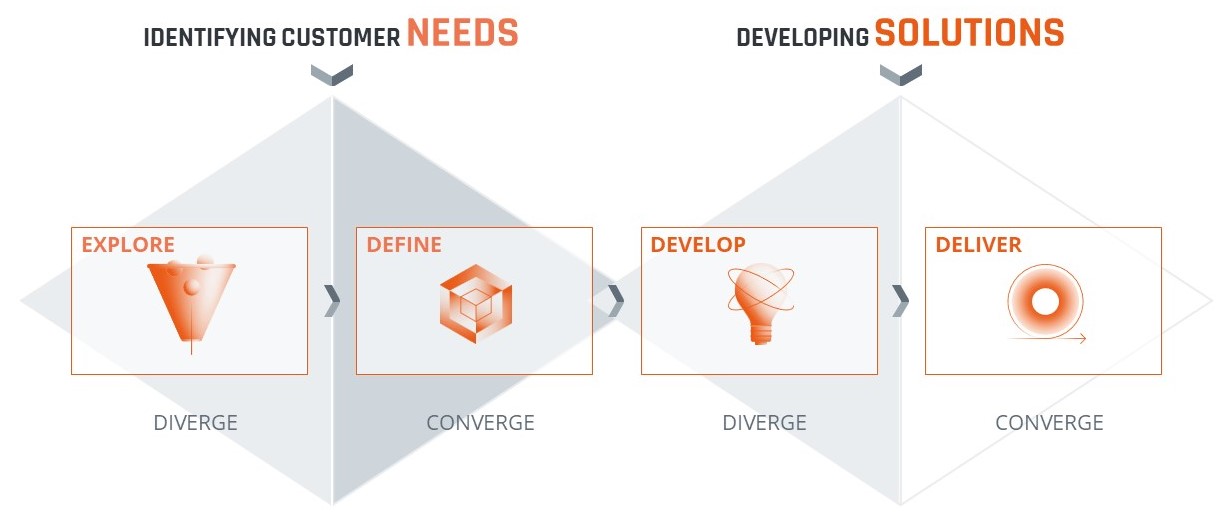
However, too many OEMs and dealers are still mired in traditional marketing and sales models where the customer’s interest comes second to the needs of the producer or retailer. The four-stage approach outlined above will help you create journeys for your existing and prospective customers that will cement their loyalty and ensure their continuing delight in your products.

Christian Herr

Christian Herr (1988) is a Principal at Berylls Mad Media. He has been a consultant for more than 10 years, advising clients in IT and CX transformations, ranging from CX strategy definition to implementation.

His professional background builds around data driven sales & marketing, especially focusing on customer experience excellence, customer journey design and execution. This includes planning and implementing customer-centric and data-driven end-to-end solutions to deliver excellent customer experiences along the entire customer journey. Before joining Berylls, he worked for various clients in different industries in Germany and abroad.

Christian studied business informatics at KIT in Karlsruhe and at DHBW in Mannheim, with focus on service management, engineering, and business informatics.